collecting tweets from user: realDonaldTrump (maximum rounds = 16)
collected 200 tweets from realDonaldTrump in round 1 || waiting for 15 seconds
collected 199 tweets from realDonaldTrump in round 2 || waiting for 15 seconds
collected 200 tweets from realDonaldTrump in round 3 || waiting for 15 seconds
collected 199 tweets from realDonaldTrump in round 4 || waiting for 15 seconds
collected 199 tweets from realDonaldTrump in round 5 || waiting for 15 seconds
collected 199 tweets from realDonaldTrump in round 6 || waiting for 15 seconds
collected 198 tweets from realDonaldTrump in round 7 || waiting for 15 seconds
collected 190 tweets from realDonaldTrump in round 8 || waiting for 15 seconds
collected 199 tweets from realDonaldTrump in round 9 || waiting for 15 seconds
collected 200 tweets from realDonaldTrump in round 10 || waiting for 15 seconds
collected 200 tweets from realDonaldTrump in round 11 || waiting for 15 seconds
collected 198 tweets from realDonaldTrump in round 12 || waiting for 15 seconds
collected 199 tweets from realDonaldTrump in round 13 || waiting for 15 seconds
collected 200 tweets from realDonaldTrump in round 14 || waiting for 15 seconds
collected 200 tweets from realDonaldTrump in round 15 || waiting for 15 seconds
collected 200 tweets from realDonaldTrump in round 16 || waiting for 15 seconds
realDonaldTrump completed
collecting tweets from user: JoeBiden (maximum rounds = 16)
collected 200 tweets from JoeBiden in round 1 || waiting for 15 seconds
collected 200 tweets from JoeBiden in round 2 || waiting for 15 seconds
collected 200 tweets from JoeBiden in round 3 || waiting for 15 seconds
collected 200 tweets from JoeBiden in round 4 || waiting for 15 seconds
collected 200 tweets from JoeBiden in round 5 || waiting for 15 seconds
collected 200 tweets from JoeBiden in round 6 || waiting for 15 seconds
collected 200 tweets from JoeBiden in round 7 || waiting for 15 seconds
collected 200 tweets from JoeBiden in round 8 || waiting for 15 seconds
collected 200 tweets from JoeBiden in round 9 || waiting for 15 seconds
collected 200 tweets from JoeBiden in round 10 || waiting for 15 seconds
collected 200 tweets from JoeBiden in round 11 || waiting for 15 seconds
collected 200 tweets from JoeBiden in round 12 || waiting for 15 seconds
collected 200 tweets from JoeBiden in round 13 || waiting for 15 seconds
collected 200 tweets from JoeBiden in round 14 || waiting for 15 seconds
collected 200 tweets from JoeBiden in round 15 || waiting for 15 seconds
collected 200 tweets from JoeBiden in round 16 || waiting for 15 seconds
JoeBiden completed
collecting tweets from user: KamalaHarris (maximum rounds = 16)
collected 200 tweets from KamalaHarris in round 1 || waiting for 15 seconds
collected 200 tweets from KamalaHarris in round 2 || waiting for 15 seconds
collected 200 tweets from KamalaHarris in round 3 || waiting for 15 seconds
collected 200 tweets from KamalaHarris in round 4 || waiting for 15 seconds
collected 200 tweets from KamalaHarris in round 5 || waiting for 15 seconds
collected 200 tweets from KamalaHarris in round 6 || waiting for 15 seconds
collected 200 tweets from KamalaHarris in round 7 || waiting for 15 seconds
collected 200 tweets from KamalaHarris in round 8 || waiting for 15 seconds
collected 199 tweets from KamalaHarris in round 9 || waiting for 15 seconds
collected 200 tweets from KamalaHarris in round 10 || waiting for 15 seconds
collected 200 tweets from KamalaHarris in round 11 || waiting for 15 seconds
collected 200 tweets from KamalaHarris in round 12 || waiting for 15 seconds
collected 199 tweets from KamalaHarris in round 13 || waiting for 15 seconds
collected 200 tweets from KamalaHarris in round 14 || waiting for 15 seconds
collected 200 tweets from KamalaHarris in round 15 || waiting for 15 seconds
collected 200 tweets from KamalaHarris in round 16 || waiting for 15 seconds
KamalaHarris completed
collecting tweets from user: Mike_Pence (maximum rounds = 16)
collected 200 tweets from Mike_Pence in round 1 || waiting for 15 seconds
collected 200 tweets from Mike_Pence in round 2 || waiting for 15 seconds
collected 200 tweets from Mike_Pence in round 3 || waiting for 15 seconds
collected 200 tweets from Mike_Pence in round 4 || waiting for 15 seconds
collected 200 tweets from Mike_Pence in round 5 || waiting for 15 seconds
collected 200 tweets from Mike_Pence in round 6 || waiting for 15 seconds
collected 200 tweets from Mike_Pence in round 7 || waiting for 15 seconds
collected 200 tweets from Mike_Pence in round 8 || waiting for 15 seconds
collected 200 tweets from Mike_Pence in round 9 || waiting for 15 seconds
collected 200 tweets from Mike_Pence in round 10 || waiting for 15 seconds
collected 200 tweets from Mike_Pence in round 11 || waiting for 15 seconds
collected 200 tweets from Mike_Pence in round 12 || waiting for 15 seconds
collected 200 tweets from Mike_Pence in round 13 || waiting for 15 seconds
collected 200 tweets from Mike_Pence in round 14 || waiting for 15 seconds
collected 200 tweets from Mike_Pence in round 15 || waiting for 15 seconds
collected 200 tweets from Mike_Pence in round 16 || waiting for 15 seconds
Mike_Pence completedTwitter Sentiment and Engagement: The Case of the Biden Campaign
Sentiment Analysis
Using several different predictive modeling strategies, I investigated how sentiment influences political reach on Twitteras well as created prediction models to predict the reach of a vet-to-be-tweeted tweet. This project found negative political tweets had higher engagement, both in terms of favorites and retweets, than non-negative tweets.
Twitter Sentiment and Engagement: The Case of the Biden Campaign
- Introduction: 310
- Hypotheses & Sub-RQs: 523
- Gathering data: 524
- Data Exploration & Evaluation: 562
- Evaluation: 548
- Limitations and Next Steps: 544
- Ethical and Normative Considerations: 559
Introduction
As the Presidential Election for the United States draws nearer, the Joe Biden campaign has run into a problem with its Twitter campaign. With just a few weeks left before the election, the Biden communication department is sharply divided in how to use his Twitter account in the final stretch of the campaign. Several members of the communications staff believe that in order to drum up enthusiasm among Biden supporters, his Twitter account should be used for negative campaigning. This would include character attacks and policy attacks against Donald Trump. Other members of Biden’s communication team believe just the opposite: negative campaigning will backfire for Biden. While negativity might help Biden rally some of his supporters, they argue, this will lead Trump to also go negative, which will benefit him more than Biden. Further, they argue that Democrats are different than Republicans and won’t react as favorably to the negativity as Trump supporters. As such the campaign has this research question:
RQ: Do tweets from political candidates that contain negative sentiment receive more engagement than tweets from political candidates that are not negative?
Many communication challenges cannot be solved by the use of digital data. However, as the present RQ question boils down to how different types of social media posts lead to different levels of online engagement with that post, this problem is one that should be looked at through the lens of digital data. Further, this case is relevant both from a theoretical perspective as well as a societal perspective. There has been ample research both into the negativity bias (Soroka & McAdams, 2015) as well as negative campaigning (Carraro & Castelli, 2010). This case will add to the research into whether a negativity bias also exists for political tweets as well as flush out the efficacy of negative campaigning on Twitter. For society, this research could also affect the campaign style of the Presidential race.
Hypotheses
People have a “negativity bias” when it comes to consuming news content, with individuals putting more weight and attention on negative information (Trussler & Soroka, 2014). Negative news, also known as “adverse media,” is news that focuses on unfavorable information and is often defined by its negative tone (Soroka, Fournier, & Nir, 2019). Studies have shown that people pay more attention to negative information than to positive information and are more likely to engage with it (Soroka & McAdams, 2015). As such, it is logical to think that negative tweets, or tweets with a negative sentiment, are more likely to attract the attention of Twitter users and lead to more engagement. Past research lends this support. Oz, Zheng, and Chen (2017) found that negative tweets had higher engagement than non-negative tweets when it comes to responses to White House’s Facebook and Twitter pages. Therefore, based on this argument by the members of Biden’s communication staff that argue in favor of negativity, the first two hypotheses are:
H1a: Negative sentiment in a tweet will be positively associated with number of retweets with the tweet.
H1b: Negative sentiment in a tweet will be positively associated with number of favorites with the tweet.
The opponents of the negative campaign strategy, however, have a valid point. Trump is a special case, who, as an avid twitter user, often resorts to coarse language, personal attacks, and straight incivility (Ott, 2017). Trump’s followers are not only more accustomed to the use of negative sentiment, they have actually shown a strong preference for tweets that include personal attacks (Lee & Xu, 2018). Therefore, while negativity might help Biden, it would help Trump even more. If the campaign becomes more negative on Twitter, that could backfire, leading Trump to be more negative and increasing his Twitter engagement. As such, the second set of hypotheses are:
H2a: The positive effect of negative sentiment on number of retweets will be greater for Trump tweets than for Biden tweets.
H2b: The positive effect of negative sentiment on number of favorites will be greater for Trump tweets than for Biden tweets.
Finally, the opponents of the negative campaign strategy also contend that Republicans are different than Democrats. The extensive work into Ideological Asymmetries by Jost (2017) backs this up. As people choose an ideology that aligns with their own psychological motivations, people of different ideologies are likely to have psychological differences. For example, research shows that Republicans a greater need to manage uncertainty and fear, while Democrats are more willing to accept some level of uncertainty in the hopes of social progress (Jost et al., 2003). It is possible that Democrats and Republicans also respond differently to the negativity. While personal attacks may work well with Republicans, that might not be the case for Democrats. Therefore, the final set of hypotheses are:
H3a: The positive effect of negative sentiment on number of retweets will be greater for Trump and Pence tweets than for Biden and Harris tweets.
H3b: The positive effect of negative sentiment on number of favorites will be greater for Trump and Pence tweets than for Biden and Harris tweets.
Data Collection
As the business challenge involves comparing the tweets, the first step in gathering the data was the obtain the last the recent tweets of Donald Trump, Joe Biden, Kamala Harris, and Mike Pence. To do this, the last 3,200 tweets from each twitter were gathered using Twitter’s API on 10 October, 2020. This method was chosen for two reasons: first, as opposed to scrapping the tweets that can often miss collecting relevant data, by using Twitter’s API, we can be reasonably confident that all of the planned tweets were gathered. Second, from a logistical standpoint, the present study is only concerned with recent Twitters that were posted during the election cycle. As Twitter’s API only allows the latest 3,200 tweets from a single user to be downloaded. This could be a problem if all user tweets were required, but since the focus is on the election, the last 3,200 tweets is sufficient.
In additional to obtaining the text of each tweet, the API downloaded some accompanying data, such as time of post, language of post, and whether media was included with the post. Also, relevant to this project, the API includes data of the overall engagement with each tweet, namely number of retweets and number of favorites.
In order to obtain the sentiment of the tweets, VADER (Valence Aware Dictionary and sEntiment Reasoner) sentiment analysis will be run on each tweet, and the negative, positive, neutral, and compound polarity scores will be added to the dataset. VADER was chosen as it is quite good at analyzing social media posts (Hutto & Gilbert, 2014).
As for privacy, the tweets will be linked to the individual users, which does pose a problem for the privacy of the twitter user. For example, they may not wish for their tweets to be included in a sentiment analysis. However, as the accounts are used in public campaigns for political office, it would seem likely that the other campaigns are also investigating their twitter data, which mitigates potential privacy concerns. Further, the privacy of the users engaging with the tweets, whether by retweeting or favoriting a post, is protected as no data is collected on those users.
While the reasoning behind the use of Twitter’s API is sound, this does not mean the data is without potential biases. The first bias could be related to the timing of the tweets. Twitter uses tweet at different rates, so the last 3,200 tweets from Trump could represent a much shorter timespan than the last 3,200 tweets from Biden, and therefore could bias the data based on different temporal factors between users. Secondly, there is a clear bias against women and people of color in the dataset. As the dataset contains tweets of three white men and only one woman, the data is skewed towards representing white men. And finally, as only one election at one time is being investigate, the generalizability of the data to other elections could be questioned. That said, as the outcome variable is tweet engagement and not something like loan approval, there are no known unwarranted associations between the outcome and protected features such as race and gender.
Above are the needed packages for the project.
Get Tweets
Above is the code to retrieve the last 3,200 tweets by a user. This code was retrieved from the GetLatest3200TweetsFromUser file.
Code to indicate of which users to collect the tweets.
Above loop retrieves all tweets. The code has been made into a comment so the data remains the same if all the code is run again.
Trump data
| created_at | id | id_str | full_text | truncated | display_text_range | entities | extended_entities | source | in_reply_to_status_id | ... | favorite_count | favorited | retweeted | possibly_sensitive | lang | retweeted_status | quoted_status_id | quoted_status_id_str | quoted_status_permalink | quoted_status | |
|---|---|---|---|---|---|---|---|---|---|---|---|---|---|---|---|---|---|---|---|---|---|
| 0 | Sat Oct 10 03:09:32 +0000 2020 | 1314764977597755392 | 1314764977597755392 | I was honored to receive the first ever Presid... | False | [0, 191] | {'hashtags': [{'text': 'LESM', 'indices': [162... | {'media': [{'id': 1314700859079524352, 'id_str... | <a href="http://twitter.com/download/iphone" r... | nan | ... | 85771 | False | False | False | en | NaN | nan | NaN | NaN | NaN |
| 1 | Sat Oct 10 02:36:30 +0000 2020 | 1314756664143347712 | 1314756664143347712 | RT @marklevinshow: My interview with the presi... | False | [0, 129] | {'hashtags': [], 'symbols': [], 'user_mentions... | NaN | <a href="http://twitter.com/download/iphone" r... | nan | ... | 0 | False | False | False | en | {'created_at': 'Fri Oct 09 23:35:36 +0000 2020... | nan | NaN | NaN | NaN |
| 2 | Fri Oct 09 23:55:24 +0000 2020 | 1314716123250778114 | 1314716123250778114 | RT @realDonaldTrump: Will be in Sanford, Flori... | False | [0, 104] | {'hashtags': [], 'symbols': [], 'user_mentions... | NaN | <a href="http://twitter.com/download/iphone" r... | nan | ... | 0 | False | False | False | en | {'created_at': 'Fri Oct 09 21:04:39 +0000 2020... | nan | NaN | NaN | NaN |
| 3 | Fri Oct 09 23:35:09 +0000 2020 | 1314711027326562306 | 1314711027326562306 | Documents reveal that General Flynn was entrap... | False | [0, 72] | {'hashtags': [], 'symbols': [], 'user_mentions... | NaN | <a href="http://twitter.com/download/iphone" r... | nan | ... | 140093 | False | False | NaN | en | NaN | nan | NaN | NaN | NaN |
| 4 | Fri Oct 09 23:31:20 +0000 2020 | 1314710067699159041 | 1314710067699159041 | .@SteveScully, the Never Trumper next debate m... | False | [0, 196] | {'hashtags': [], 'symbols': [], 'user_mentions... | NaN | <a href="http://twitter.com/download/iphone" r... | nan | ... | 121620 | False | False | NaN | en | NaN | nan | NaN | NaN | NaN |
5 rows × 31 columns
created_at 0
id 0
id_str 0
full_text 0
truncated 0
display_text_range 0
entities 0
extended_entities 2514
source 0
in_reply_to_status_id 3074
in_reply_to_status_id_str 3074
in_reply_to_user_id 3071
in_reply_to_user_id_str 3071
in_reply_to_screen_name 3071
user 0
geo 3165
coordinates 3165
place 3165
contributors 3165
is_quote_status 0
retweet_count 0
favorite_count 0
favorited 0
retweeted 0
possibly_sensitive 1837
lang 0
retweeted_status 1598
quoted_status_id 2603
quoted_status_id_str 2603
quoted_status_permalink 2603
quoted_status 2830
Trump 0
Biden 0
Harris 0
Pence 0
Republican 0
dtype: int643165The Trump dataset is imported. Variables are added for indicate the tweets are from Trump, who is a Republican. Then missing values are checked for the text of the tweet as well as the newly created variables. Finally, I check the lengths of the datasets. The same is then done for Joe Biden, Kamala Harris, and Mike Pence.
Biden Data
created_at 0
id 0
id_str 0
full_text 0
truncated 0
display_text_range 0
entities 0
extended_entities 2113
source 0
in_reply_to_status_id 3085
in_reply_to_status_id_str 3085
in_reply_to_user_id 3085
in_reply_to_user_id_str 3085
in_reply_to_screen_name 3085
user 0
geo 3185
coordinates 3185
place 3185
contributors 3185
is_quote_status 0
retweet_count 0
favorite_count 0
favorited 0
retweeted 0
possibly_sensitive 1007
lang 0
quoted_status_id 2733
quoted_status_id_str 2733
quoted_status_permalink 2733
quoted_status 2745
retweeted_status 3031
Trump 0
Biden 0
Harris 0
Pence 0
Republican 0
dtype: int643185Harris Data
created_at 0
id 0
id_str 0
full_text 0
truncated 0
display_text_range 0
entities 0
source 0
in_reply_to_status_id 3129
in_reply_to_status_id_str 3129
in_reply_to_user_id 3129
in_reply_to_user_id_str 3129
in_reply_to_screen_name 3129
user 0
geo 3183
coordinates 3183
place 3182
contributors 3183
is_quote_status 0
retweet_count 0
favorite_count 0
favorited 0
retweeted 0
lang 0
possibly_sensitive 1272
retweeted_status 2760
extended_entities 2370
quoted_status_id 2706
quoted_status_id_str 2706
quoted_status_permalink 2706
quoted_status 2729
Trump 0
Biden 0
Harris 0
Pence 0
Republican 0
dtype: int643183Pence Data
created_at 0
id 0
id_str 0
full_text 0
truncated 0
display_text_range 0
entities 0
source 0
in_reply_to_status_id 3124
in_reply_to_status_id_str 3124
in_reply_to_user_id 3124
in_reply_to_user_id_str 3124
in_reply_to_screen_name 3124
user 0
geo 3185
coordinates 3185
place 3185
contributors 3185
retweeted_status 928
is_quote_status 0
retweet_count 0
favorite_count 0
favorited 0
retweeted 0
lang 0
possibly_sensitive 1814
extended_entities 2181
quoted_status_id 3066
quoted_status_id_str 3066
quoted_status_permalink 3066
quoted_status 3167
Trump 0
Biden 0
Harris 0
Pence 0
Republican 0
dtype: int64Merge
1.0Finally, the four datasets are merged. Then a quick check is run to make sure the length of the new dataset is correct.
Data Cleaning
First, a simple inspection of the data is performed.
| full_text | retweet_count | favorite_count | |
|---|---|---|---|
| 0 | I was honored to receive the first ever Presid... | 20884 | 85771 |
| 1 | RT @marklevinshow: My interview with the presi... | 17307 | 0 |
| 2 | RT @realDonaldTrump: Will be in Sanford, Flori... | 25471 | 0 |
| 3 | Documents reveal that General Flynn was entrap... | 41969 | 140093 |
| 4 | .@SteveScully, the Never Trumper next debate m... | 33220 | 121620 |
12718created_at 0
id 0
id_str 0
full_text 0
truncated 0
display_text_range 0
entities 0
extended_entities 9178
source 0
in_reply_to_status_id 12412
in_reply_to_status_id_str 12412
in_reply_to_user_id 12409
in_reply_to_user_id_str 12409
in_reply_to_screen_name 12409
user 0
geo 12718
coordinates 12718
place 12717
contributors 12718
is_quote_status 0
retweet_count 0
favorite_count 0
favorited 0
retweeted 0
possibly_sensitive 5930
lang 0
retweeted_status 8317
quoted_status_id 11108
quoted_status_id_str 11108
quoted_status_permalink 11108
quoted_status 11471
Trump 0
Biden 0
Harris 0
Pence 0
Republican 0
dtype: int64Drop Retweets
The first task was to drop unwanted observations. For this project, tweets that are retweets are not of interest. This was decided for two reasons. First, the research question and hypotheses were about the negativity of Biden’s tweets. This is about the tweets he writes, not the tweets written by other people. It therefore makes sense to exclude retweets. Second, from a more practical standpoint, retweets are not favorited, only the original tweet can be favorited. Therefore, all retweets have a favorite count of zero, which is not an accurate representation of how much people liked or engaged with the retweet. Therefore, it was decided to drop all retweets from the dataset. To do so, a new variable was created to determine if the tweet was a retweet, and if it was, it was dropped.
| full_text | is_retweet | |
|---|---|---|
| 0 | I was honored to receive the first ever Presid... | 0 |
| 1 | RT @marklevinshow: My interview with the presi... | 1 |
| 2 | RT @realDonaldTrump: Will be in Sanford, Flori... | 1 |
| 3 | Documents reveal that General Flynn was entrap... | 0 |
| 4 | .@SteveScully, the Never Trumper next debate m... | 0 |
44014,401 of the tweets were retweets.
8317The new dataset has 8,317 tweets, none of which are retweets.
| full_text | retweet_count | favorite_count | is_retweet | |
|---|---|---|---|---|
| 0 | I was honored to receive the first ever Presid... | 20884 | 85771 | 0 |
| 3 | Documents reveal that General Flynn was entrap... | 41969 | 140093 | 0 |
| 4 | .@SteveScully, the Never Trumper next debate m... | 33220 | 121620 | 0 |
| 5 | Thank you @SenatorDole. So true! https://t.co/... | 15147 | 58881 | 0 |
| 6 | https://t.co/UGIAvC7VA3 | 19078 | 54239 | 0 |
The index of the dataset was then reset.
Check date of Tweets
Next, it was important to ensure that none of the tweets were from before the election cycle, so the date created variable was changed into a datetime variable.
0 Sat Oct 10 03:09:32 +0000 2020
1 Fri Oct 09 23:35:09 +0000 2020
2 Fri Oct 09 23:31:20 +0000 2020
3 Fri Oct 09 23:01:54 +0000 2020
4 Fri Oct 09 22:30:20 +0000 2020
Name: created_at, dtype: object0 2020-10-10 03:09:32+00:00
1 2020-10-09 23:35:09+00:00
2 2020-10-09 23:31:20+00:00
3 2020-10-09 23:01:54+00:00
4 2020-10-09 22:30:20+00:00
Name: created_at, dtype: datetime64[ns, UTC]count 8317
unique 8191
top 2020-05-19 22:23:51+00:00
freq 4
first 2019-08-05 17:58:00+00:00
last 2020-10-10 03:09:32+00:00
Name: created_at, dtype: objectThe oldest tweet is from August 5th, 2019. This is after all four had begun campaigning so no tweets need to be dropped.
| index | created_at | id | id_str | full_text | truncated | display_text_range | entities | extended_entities | source | ... | quoted_status_id | quoted_status_id_str | quoted_status_permalink | quoted_status | Trump | Biden | Harris | Pence | Republican | is_retweet | |
|---|---|---|---|---|---|---|---|---|---|---|---|---|---|---|---|---|---|---|---|---|---|
| 7388 | 199 | 2019-08-05 17:58:00+00:00 | 1158437011692429314 | 1158437011692429314 | Gun violence is an epidemic. It impacts our co... | False | [0, 179] | {'hashtags': [], 'symbols': [], 'user_mentions... | NaN | <a href="https://sproutsocial.com" rel="nofoll... | ... | 1158211041999970304.000 | 1158211041999970317 | {'url': 'https://t.co/GqZAZurc8D', 'expanded':... | {'created_at': 'Mon Aug 05 03:00:05 +0000 2019... | 0 | 0 | 1 | 0 | 0 | 0 |
1 rows × 38 columns
| index | created_at | id | id_str | full_text | truncated | display_text_range | entities | extended_entities | source | ... | quoted_status_id | quoted_status_id_str | quoted_status_permalink | quoted_status | Trump | Biden | Harris | Pence | Republican | is_retweet | |
|---|---|---|---|---|---|---|---|---|---|---|---|---|---|---|---|---|---|---|---|---|---|
| 4628 | 199 | 2019-10-26 21:03:00+00:00 | 1188199370463821824 | 1188199370463821824 | If you work hard, you should be able to share ... | False | [0, 276] | {'hashtags': [], 'symbols': [], 'user_mentions... | NaN | <a href="https://about.twitter.com/products/tw... | ... | nan | NaN | NaN | NaN | 0 | 1 | 0 | 0 | 0 | 0 |
1 rows × 38 columns
| index | created_at | id | id_str | full_text | truncated | display_text_range | entities | extended_entities | source | ... | quoted_status_id | quoted_status_id_str | quoted_status_permalink | quoted_status | Trump | Biden | Harris | Pence | Republican | is_retweet | |
|---|---|---|---|---|---|---|---|---|---|---|---|---|---|---|---|---|---|---|---|---|---|
| 1597 | 185 | 2020-07-17 16:25:03+00:00 | 1284162207232733185 | 1284162207232733185 | THANK YOU to the 5 million members of the @NRA... | False | [0, 284] | {'hashtags': [], 'symbols': [], 'user_mentions... | NaN | <a href="http://twitter.com/download/iphone" r... | ... | 1283748224243728384.000 | 1283748224243728384 | {'url': 'https://t.co/8ZhChqxgBI', 'expanded':... | {'created_at': 'Thu Jul 16 13:00:02 +0000 2020... | 1 | 0 | 0 | 0 | 1 | 0 |
1 rows × 38 columns
Add sentiment scores of each tweet
To add the sentiment scores of the tweets, I created a for loop that added the scores to lists that were then added to the dataset.
| full_text | positive | negative | neutral | compound | |
|---|---|---|---|---|---|
| 0 | I was honored to receive the first ever Presid... | 0.270 | 0.000 | 0.730 | 0.836 |
| 1 | Documents reveal that General Flynn was entrap... | 0.000 | 0.000 | 1.000 | 0.000 |
| 2 | .@SteveScully, the Never Trumper next debate m... | 0.000 | 0.173 | 0.827 | -0.742 |
| 3 | Thank you @SenatorDole. So true! https://t.co/... | 0.616 | 0.000 | 0.384 | 0.751 |
| 4 | https://t.co/UGIAvC7VA3 | 0.000 | 0.000 | 1.000 | 0.000 |
Media in tweet
Next, I added the control variable for whether media was included in the tweet. As some tweets can have photos or videos while others do not, it is important to control of the differences that might affect the overal engagement. I did this by adding a variable for whether the ‘extended_entities’ varaible mentioned media or not. I used a function provided in the ‘useful functions’ file.
0 {'media': [{'id': 1314700859079524352, 'id_str...
1 NaN
2 NaN
3 NaN
4 NaN
Name: extended_entities, dtype: object| media | extended_entities | |
|---|---|---|
| 0 | 1 | {'media': [{'id': 1314700859079524352, 'id_str... |
| 1 | 0 | NaN |
| 2 | 0 | NaN |
| 3 | 0 | NaN |
| 4 | 0 | NaN |
Length of Tweet
A control variable for the length of the tweet was also created. Past research has shown different length tweets have different effects (Han, Gu, & Peng, 2019), so it is therefore important to control for these differences.
0 191
1 72
2 196
3 56
4 23
Name: length, dtype: int64index int64
created_at datetime64[ns, UTC]
id int64
id_str object
full_text object
truncated bool
display_text_range object
entities object
extended_entities object
source object
in_reply_to_status_id object
in_reply_to_status_id_str object
in_reply_to_user_id object
in_reply_to_user_id_str object
in_reply_to_screen_name object
user object
geo object
coordinates object
place object
contributors object
is_quote_status bool
retweet_count int64
favorite_count int64
favorited bool
retweeted bool
possibly_sensitive object
lang object
retweeted_status object
quoted_status_id float64
quoted_status_id_str object
quoted_status_permalink object
quoted_status object
Trump int64
Biden int64
Harris int64
Pence int64
Republican int64
is_retweet int64
positive float64
negative float64
neutral float64
compound float64
media int64
length int64
dtype: objectnegative 0
length 0
media 0
retweet_count 0
favorite_count 0
Trump 0
Republican 0
dtype: int64No missing values in any of the varaibles of interest.
# Data Exploration and Evaluation
To begin the data exploration and evaluation process, descriptive tables were made. A summary of the descriptive statistic findings can be found at the end of this section.
| count | mean | std | min | 25% | 50% | 75% | max | |
|---|---|---|---|---|---|---|---|---|
| retweet_count | 8317.000 | 9504.060 | 15685.700 | 0.000 | 1044.000 | 3803.000 | 11897.000 | 415300.000 |
| favorite_count | 8317.000 | 45996.824 | 84388.376 | 0.000 | 4746.000 | 17474.000 | 54063.000 | 1897125.000 |
| negative | 8317.000 | 0.075 | 0.100 | 0.000 | 0.000 | 0.037 | 0.127 | 0.831 |
| length | 8317.000 | 184.580 | 83.943 | 7.000 | 118.000 | 199.000 | 260.000 | 320.000 |
| media | 8317.000 | 0.340 | 0.474 | 0.000 | 0.000 | 0.000 | 1.000 | 1.000 |
| user | Biden | Harris | Pence | Trump | |
|---|---|---|---|---|---|
| retweet_count | count | 3031.000 | 2760.000 | 928.000 | 1598.000 |
| mean | 9488.394 | 4064.164 | 1925.446 | 23330.440 | |
| std | 16340.594 | 7964.101 | 2845.855 | 19608.835 | |
| min | 11.000 | 2.000 | 68.000 | 0.000 | |
| 25% | 1626.000 | 696.000 | 514.750 | 11194.250 | |
| 50% | 4719.000 | 1648.500 | 940.000 | 18227.500 | |
| 75% | 11310.000 | 4281.500 | 1971.500 | 29937.750 | |
| max | 327694.000 | 184872.000 | 26943.000 | 415300.000 | |
| favorite_count | count | 3031.000 | 2760.000 | 928.000 | 1598.000 |
| mean | 50704.301 | 21228.082 | 9487.755 | 101049.254 | |
| std | 99206.297 | 44229.749 | 13808.130 | 100050.109 | |
| min | 34.000 | 12.000 | 259.000 | 0.000 | |
| 25% | 7168.500 | 2955.000 | 2698.000 | 44051.250 | |
| 50% | 20899.000 | 7642.000 | 4863.500 | 73987.000 | |
| 75% | 53120.500 | 21452.000 | 9785.250 | 125285.250 | |
| max | 1897125.000 | 1001691.000 | 167461.000 | 1885859.000 | |
| negative | count | 3031.000 | 2760.000 | 928.000 | 1598.000 |
| mean | 0.079 | 0.090 | 0.027 | 0.072 | |
| std | 0.096 | 0.100 | 0.054 | 0.118 | |
| min | 0.000 | 0.000 | 0.000 | 0.000 | |
| 25% | 0.000 | 0.000 | 0.000 | 0.000 | |
| 50% | 0.050 | 0.066 | 0.000 | 0.000 | |
| 75% | 0.133 | 0.147 | 0.038 | 0.117 | |
| max | 0.658 | 0.612 | 0.363 | 0.831 |
| Trump | 0 | 1 | |
|---|---|---|---|
| negative | count | 6719.000 | 1598.000 |
| mean | 0.076 | 0.072 | |
| std | 0.095 | 0.118 | |
| min | 0.000 | 0.000 | |
| 25% | 0.000 | 0.000 | |
| 50% | 0.046 | 0.000 | |
| 75% | 0.128 | 0.117 | |
| max | 0.658 | 0.831 |
| Republican | 0 | 1 | |
|---|---|---|---|
| retweet_count | count | 5791.000 | 2526.000 |
| mean | 6903.197 | 15466.689 | |
| std | 13315.315 | 18780.076 | |
| min | 2.000 | 0.000 | |
| 25% | 940.500 | 1476.500 | |
| 50% | 2830.000 | 10606.500 | |
| 75% | 7677.000 | 22462.000 | |
| max | 327694.000 | 415300.000 | |
| favorite_count | count | 5791.000 | 2526.000 |
| mean | 36655.887 | 67411.459 | |
| std | 79368.617 | 91379.912 | |
| min | 12.000 | 0.000 | |
| 25% | 4134.000 | 7624.500 | |
| 50% | 12720.000 | 42340.000 | |
| 75% | 36720.000 | 94136.750 | |
| max | 1897125.000 | 1885859.000 | |
| negative | count | 5791.000 | 2526.000 |
| mean | 0.084 | 0.055 | |
| std | 0.098 | 0.102 | |
| min | 0.000 | 0.000 | |
| 25% | 0.000 | 0.000 | |
| 50% | 0.057 | 0.000 | |
| 75% | 0.140 | 0.081 | |
| max | 0.658 | 0.831 |
Distribution plots of negative sentiment scores.
<AxesSubplot:xlabel='negative', ylabel='Density'>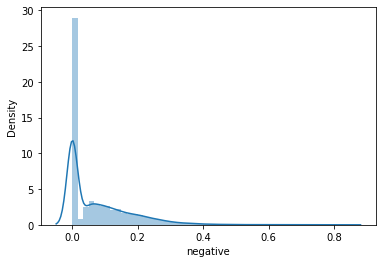
This plot isn’t the most informative, as many of the values are 0. To have a more informative graph, the distribtion plot was zoomed in.
(0.0, 10.0)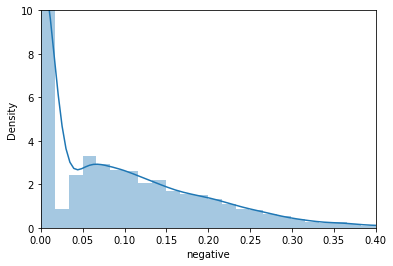
Distribution plot of favorite count
<AxesSubplot:xlabel='favorite_count', ylabel='Density'>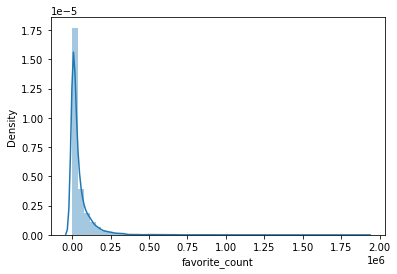
This plot isn’t the most informative, as many of the values are 0. To have a more informative graph, the distribtion plot was zoomed in.
(0.0, 200000.0)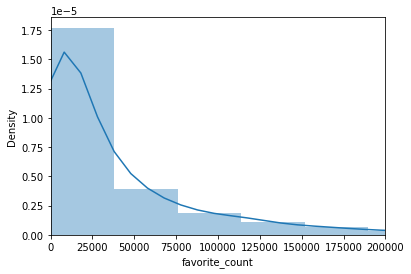
Distribution plot of the logarithmic transformation of favorite count
<AxesSubplot:xlabel='favorite_count', ylabel='Density'>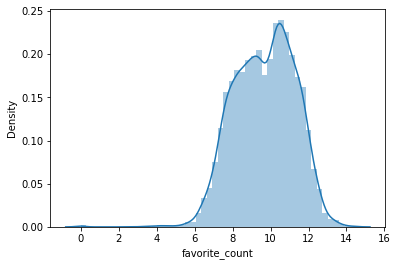
Distribution plot of retweet count
(0.0, 80000.0)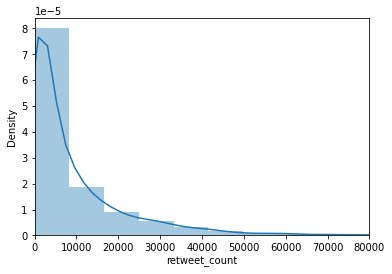
Distribution plot of the logarithmic transformation of retweet count
<AxesSubplot:xlabel='retweet_count', ylabel='Density'>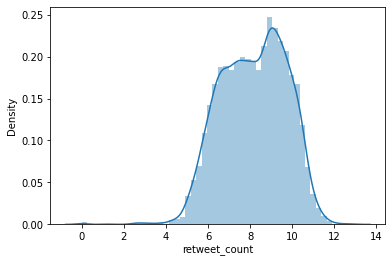
Distribution plot of the length of the tweet
<AxesSubplot:xlabel='length', ylabel='Density'>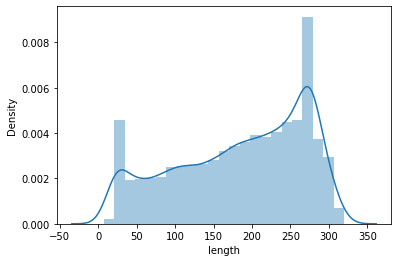
<AxesSubplot:xlabel='media', ylabel='count'>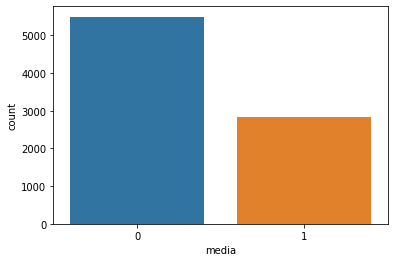
Above is a countplot for whether media was part of the tweet or not.
<AxesSubplot:xlabel='user', ylabel='favorite_count'>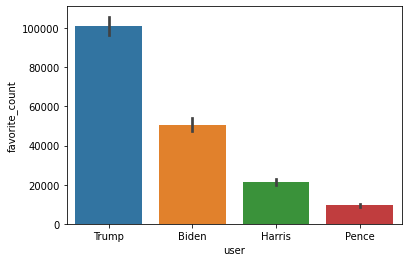
Above is a barplot for average number of favorites per tweet by user.
<AxesSubplot:xlabel='user', ylabel='retweet_count'>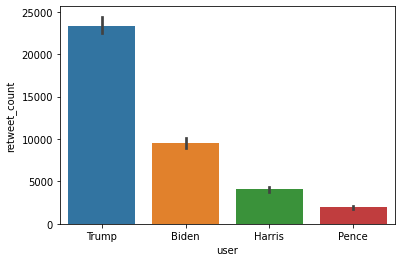
Above is a barplot for average number of retweets per tweet by user.
<AxesSubplot:xlabel='user', ylabel='negative'>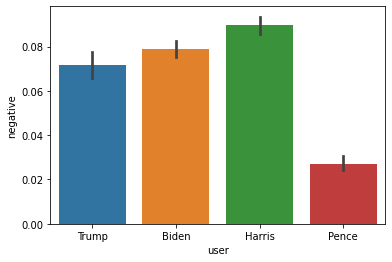
Above is a barplot for average negative sentiment per tweet by user.
<AxesSubplot:xlabel='Trump', ylabel='negative'>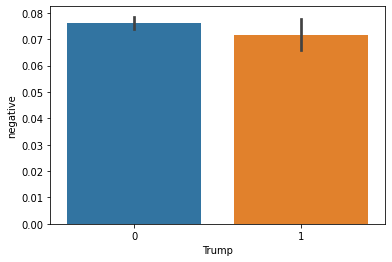
Above is a barplot of the average negative sentiment per tweet between Trump tweets and non-Trump tweets.
<AxesSubplot:xlabel='Republican', ylabel='negative'>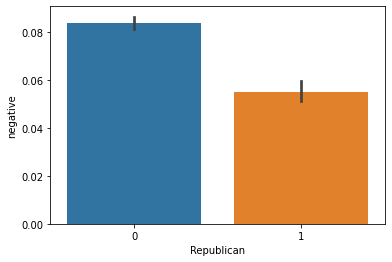
Above is a barplot of the average negative sentiment per tweet between Republican tweets and non-Republican tweets.
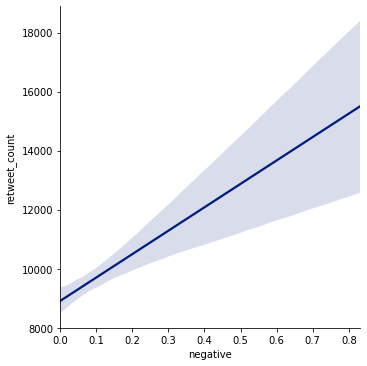
<AxesSubplot:xlabel='negative', ylabel='retweet_count'>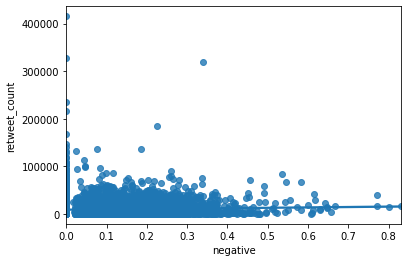
Above is a regression plot of negative sentiment against retweet count.
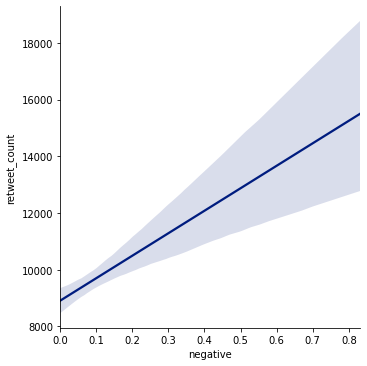
<AxesSubplot:xlabel='negative', ylabel='retweet_count'>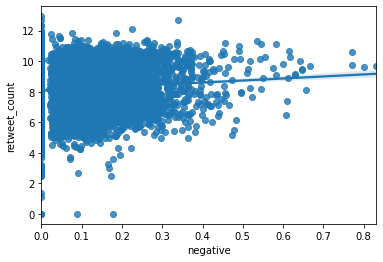
Above is a regression plot of negative sentiment against the logarithmic transformation of retweet count.
<AxesSubplot:xlabel='negative', ylabel='favorite_count'>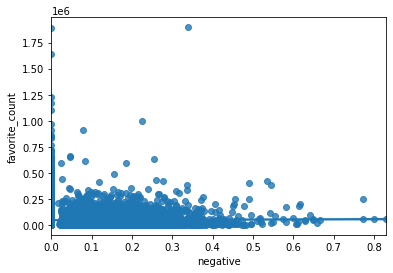
Above is a regression plot of negative sentiment against favorite count.
<AxesSubplot:xlabel='negative', ylabel='favorite_count'>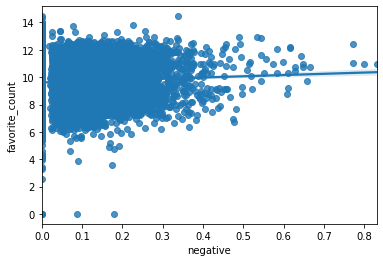
Above is a regression plot of negative sentiment against the logarithmic transformation of favorite count.
Summary for stakeholders
The present research project uses two different dependent variables or outcomes for the concept of engagement. The first variable is the number of retweets each tweet has received. A retweet is when the tweet is reposted by another individual. For these four users, the average number of retweets was 9,504.06 (SD = 15,685.70). Trump had by far the highest average number of retweets (M = 23,330.44; SD = 19,608.84), followed by Biden (M = 9,488.39; SD = 16,340.59), Harris (M = 4,064.16; SD = 7,964.10), and Pence (M = 1,925.45; SD = 16,340.59), respectively. The second variable is the number of favorites each tweet has received. A favorite is when the tweet is liked or ‘favorited’ by another individual. For these four users, the average number of favorites was 45,996.82 (SD = 84,388.38). Trump again had the highest average number of favorites (M = 100,050.11; SD = 100,050.11), followed by Biden (M = 50,704.30; SD = 99,206.30), Harris (M = 21,228.08; SD = 44,229.75), and Pence (M = 9,487.76; SD = 13,808.13), respectively.
As for the sentiment of the tweets, the average tweet was not very negative, with an average negative polarity of 0.08 (SD = 0.10), with 0 being neutral and 1 being completely negative. Harris was the most negative (M = 0.09; SD = 0.10), followed closely by Biden (M = 0.08; SD = 0.10) and Trump (M = 0.07; SD = 0.12), with Pence being the least negative (M = 0.03; SD = 0.05).
Turning from specific users to Presidential and Vice Presidential candidates differences by party, Republicans on average had a higher number of retweets per tweet (M = 15,466.69; SD = 18,780.07) compared to Democrats (M = 6,903.20; SD = 13,315.32) and a higher number of favorites per tweet (M = 67,411.46; SD = 91,379.91) compared to Democrats (M = 36,655.89; SD = 79,368.62). Clearly, this is driven mostly by Trump’s popularity. In terms of negativity, Democrats had a higher average negative polarity scores (M = 0.08, SD = 0.10) compared to Republicans (M = 0.06, SD = 0.10).
The average length of the tweets was 184.58 characters (SD = 83.94), and about a third (34%) of the tweets included some form of media such as a video or photograph.
The distributions for retweet count, favorite count, and negative sentiment are positively skewed due to the high number of values around zero and due to the large number of positive outliers, making the data unbalanced. As these variables are not normally distributed, this could violate the regression assumption of normality as it implies that residuals might also not be normally distributed. This can be checked with a plot of errors, and if they are not normally distributed, this could be addressed using a log transformation, as shown in the distribution plots. However, for the sake of model interpretability and machine learning predictions, this project will use the original data without transformations (except for the above regression plots). This is a possible drawback, however, which is discussed in the limitation section below.
Because of this skew, the regression plots with negativity as the IV and retweet count or favorite count as the DV are not very informative. However, when the log is taken of the DVs, there seems to be a slight positive relationship between negative sentiment and engagement, as indicated by the slope of the regression line.
Models
Model 1: retweet count without controls
OLS Regression Results
==============================================================================
Dep. Variable: retweet_count R-squared: 0.218
Model: OLS Adj. R-squared: 0.217
Method: Least Squares F-statistic: 578.0
Date: Sun, 18 Oct 2020 Prob (F-statistic): 0.00
Time: 18:28:33 Log-Likelihood: -91127.
No. Observations: 8317 AIC: 1.823e+05
Df Residuals: 8312 BIC: 1.823e+05
Df Model: 4
Covariance Type: nonrobust
==============================================================================
coef std err t P>|t| [0.025 0.975]
------------------------------------------------------------------------------
Intercept 8879.9043 280.050 31.708 0.000 8330.936 9428.872
negative 7716.0918 1547.219 4.987 0.000 4683.157 1.07e+04
Trump 1.39e+04 429.173 32.384 0.000 1.31e+04 1.47e+04
Pence -7164.3142 526.749 -13.601 0.000 -8196.874 -6131.755
Harris -5507.5940 365.513 -15.068 0.000 -6224.091 -4791.097
==============================================================================
Omnibus: 12425.873 Durbin-Watson: 1.481
Prob(Omnibus): 0.000 Jarque-Bera (JB): 9983022.957
Skew: 8.916 Prob(JB): 0.00
Kurtosis: 171.789 Cond. No. 11.1
==============================================================================
Notes:
[1] Standard Errors assume that the covariance matrix of the errors is correctly specified.Fit
The first model investigate the main effect of negative sentiment on retweet count. Binary variables are added for Trump, Pence, and Harris. Therefore the reference category is Biden tweets. The R-squared is 0.22, indicating 22% of the variance of retweet count is explained by the model.
Model 2: retweet count with controls
OLS Regression Results
==============================================================================
Dep. Variable: retweet_count R-squared: 0.235
Model: OLS Adj. R-squared: 0.234
Method: Least Squares F-statistic: 425.3
Date: Sun, 18 Oct 2020 Prob (F-statistic): 0.00
Time: 18:28:33 Log-Likelihood: -91034.
No. Observations: 8317 AIC: 1.821e+05
Df Residuals: 8310 BIC: 1.821e+05
Df Model: 6
Covariance Type: nonrobust
==============================================================================
coef std err t P>|t| [0.025 0.975]
------------------------------------------------------------------------------
Intercept 1.409e+04 495.004 28.463 0.000 1.31e+04 1.51e+04
negative 7869.0982 1557.796 5.051 0.000 4815.429 1.09e+04
Trump 1.233e+04 445.700 27.675 0.000 1.15e+04 1.32e+04
Harris -5772.8657 362.105 -15.943 0.000 -6482.682 -5063.049
Pence -6395.8029 525.282 -12.176 0.000 -7425.486 -5366.119
length -20.1916 1.941 -10.403 0.000 -23.996 -16.387
media -3507.9851 331.520 -10.582 0.000 -4157.847 -2858.124
==============================================================================
Omnibus: 12443.464 Durbin-Watson: 1.486
Prob(Omnibus): 0.000 Jarque-Bera (JB): 10317471.100
Skew: 8.928 Prob(JB): 0.00
Kurtosis: 174.621 Cond. No. 2.11e+03
==============================================================================
Notes:
[1] Standard Errors assume that the covariance matrix of the errors is correctly specified.
[2] The condition number is large, 2.11e+03. This might indicate that there are
strong multicollinearity or other numerical problems.Fit
The second model mirrors the first but includes the control variables of length and media. The R-squared improved to 0.24, so model 2 is preferred over model 1.
The positive effect of negative sentiment on retweet count can be visualized above.
Model 3: favorite count without controls
OLS Regression Results
==============================================================================
Dep. Variable: favorite_count R-squared: 0.132
Model: OLS Adj. R-squared: 0.132
Method: Least Squares F-statistic: 317.4
Date: Sun, 18 Oct 2020 Prob (F-statistic): 1.61e-254
Time: 18:28:34 Log-Likelihood: -1.0555e+05
No. Observations: 8317 AIC: 2.111e+05
Df Residuals: 8312 BIC: 2.111e+05
Df Model: 4
Covariance Type: nonrobust
==============================================================================
coef std err t P>|t| [0.025 0.975]
------------------------------------------------------------------------------
Intercept 5.003e+04 1586.501 31.535 0.000 4.69e+04 5.31e+04
negative 8544.2518 8765.092 0.975 0.330 -8637.514 2.57e+04
Trump 5.041e+04 2431.291 20.733 0.000 4.56e+04 5.52e+04
Harris -2.957e+04 2070.655 -14.280 0.000 -3.36e+04 -2.55e+04
Pence -4.078e+04 2984.066 -13.664 0.000 -4.66e+04 -3.49e+04
==============================================================================
Omnibus: 11758.802 Durbin-Watson: 1.428
Prob(Omnibus): 0.000 Jarque-Bera (JB): 5440616.514
Skew: 8.187 Prob(JB): 0.00
Kurtosis: 127.224 Cond. No. 11.1
==============================================================================
Notes:
[1] Standard Errors assume that the covariance matrix of the errors is correctly specified.Fit
The third model investigate the main effect of negative sentiment on favorite count. Binary variables are added for Trump, Pence, and Harris, so again the reference category is Biden tweets. The R-squared is 0.13, indicating 13% of the variance of favorite count is explained by the model.
Model 4: favorite count with controls
OLS Regression Results
==============================================================================
Dep. Variable: favorite_count R-squared: 0.170
Model: OLS Adj. R-squared: 0.170
Method: Least Squares F-statistic: 284.7
Date: Sun, 18 Oct 2020 Prob (F-statistic): 0.00
Time: 18:28:34 Log-Likelihood: -1.0536e+05
No. Observations: 8317 AIC: 2.107e+05
Df Residuals: 8310 BIC: 2.108e+05
Df Model: 6
Covariance Type: nonrobust
==============================================================================
coef std err t P>|t| [0.025 0.975]
------------------------------------------------------------------------------
Intercept 9.223e+04 2773.014 33.259 0.000 8.68e+04 9.77e+04
negative 1.115e+04 8726.784 1.278 0.201 -5954.323 2.83e+04
Trump 3.761e+04 2496.816 15.063 0.000 3.27e+04 4.25e+04
Harris -3.164e+04 2028.517 -15.597 0.000 -3.56e+04 -2.77e+04
Pence -3.484e+04 2942.633 -11.839 0.000 -4.06e+04 -2.91e+04
length -166.7139 10.873 -15.333 0.000 -188.027 -145.401
media -2.691e+04 1857.176 -14.490 0.000 -3.06e+04 -2.33e+04
==============================================================================
Omnibus: 11746.789 Durbin-Watson: 1.423
Prob(Omnibus): 0.000 Jarque-Bera (JB): 5685698.422
Skew: 8.148 Prob(JB): 0.00
Kurtosis: 130.049 Cond. No. 2.11e+03
==============================================================================
Notes:
[1] Standard Errors assume that the covariance matrix of the errors is correctly specified.
[2] The condition number is large, 2.11e+03. This might indicate that there are
strong multicollinearity or other numerical problems.Fit
The fourth model mirrors the third but includes the control variables of length and media. The R-squared improved to 0.17, so model 4 is preferred over model 3.
The positive effect of negative sentiment on favorite count can be visualized above.
Model 5: Interaction between negative sentiment and Trump tweets on retweet count
OLS Regression Results
==============================================================================
Dep. Variable: retweet_count R-squared: 0.237
Model: OLS Adj. R-squared: 0.236
Method: Least Squares F-statistic: 368.6
Date: Sun, 18 Oct 2020 Prob (F-statistic): 0.00
Time: 18:28:35 Log-Likelihood: -91023.
No. Observations: 8317 AIC: 1.821e+05
Df Residuals: 8309 BIC: 1.821e+05
Df Model: 7
Covariance Type: nonrobust
==================================================================================
coef std err t P>|t| [0.025 0.975]
----------------------------------------------------------------------------------
Intercept 1.451e+04 502.684 28.869 0.000 1.35e+04 1.55e+04
negative 3575.2435 1809.547 1.976 0.048 28.079 7122.408
Trump 1.113e+04 515.496 21.585 0.000 1.01e+04 1.21e+04
negative:Trump 1.593e+04 3428.586 4.647 0.000 9212.256 2.27e+04
Harris -5720.2414 361.835 -15.809 0.000 -6429.528 -5010.955
Pence -6644.8885 527.363 -12.600 0.000 -7678.652 -5611.125
length -20.8055 1.943 -10.708 0.000 -24.614 -16.997
media -3397.9422 331.955 -10.236 0.000 -4048.658 -2747.227
==============================================================================
Omnibus: 12482.896 Durbin-Watson: 1.488
Prob(Omnibus): 0.000 Jarque-Bera (JB): 10530335.745
Skew: 8.981 Prob(JB): 0.00
Kurtosis: 176.391 Cond. No. 4.84e+03
==============================================================================
Notes:
[1] Standard Errors assume that the covariance matrix of the errors is correctly specified.
[2] The condition number is large, 4.84e+03. This might indicate that there are
strong multicollinearity or other numerical problems.Fit
The fifth model investigate the interaction effect of negative sentiment and Trump tweets on retweet count. Binary variables are added for Trump, Pence, and Harris, so again the reference category is Biden tweets. The R-squared is 0.24, indicating 24% of the variance of retweet count is explained by the model.
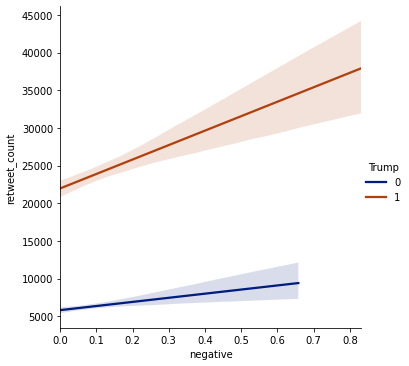
The greater positive effect of negative sentiment on retweet count for Trump can be visualized above.
Model 6: Interaction between negative sentiment and Trump tweets on favorite count
OLS Regression Results
==============================================================================
Dep. Variable: favorite_count R-squared: 0.171
Model: OLS Adj. R-squared: 0.171
Method: Least Squares F-statistic: 245.6
Date: Sun, 18 Oct 2020 Prob (F-statistic): 0.00
Time: 18:28:36 Log-Likelihood: -1.0536e+05
No. Observations: 8317 AIC: 2.107e+05
Df Residuals: 8309 BIC: 2.108e+05
Df Model: 7
Covariance Type: nonrobust
==================================================================================
coef std err t P>|t| [0.025 0.975]
----------------------------------------------------------------------------------
Intercept 9.381e+04 2818.073 33.287 0.000 8.83e+04 9.93e+04
negative -4885.0701 1.01e+04 -0.482 0.630 -2.48e+04 1.5e+04
Trump 3.31e+04 2889.895 11.453 0.000 2.74e+04 3.88e+04
negative:Trump 5.951e+04 1.92e+04 3.096 0.002 2.18e+04 9.72e+04
Harris -3.144e+04 2028.463 -15.500 0.000 -3.54e+04 -2.75e+04
Pence -3.577e+04 2956.423 -12.098 0.000 -4.16e+04 -3e+04
length -169.0068 10.892 -15.516 0.000 -190.358 -147.655
media -2.65e+04 1860.958 -14.240 0.000 -3.01e+04 -2.29e+04
==============================================================================
Omnibus: 11768.342 Durbin-Watson: 1.424
Prob(Omnibus): 0.000 Jarque-Bera (JB): 5756018.104
Skew: 8.174 Prob(JB): 0.00
Kurtosis: 130.838 Cond. No. 4.84e+03
==============================================================================
Notes:
[1] Standard Errors assume that the covariance matrix of the errors is correctly specified.
[2] The condition number is large, 4.84e+03. This might indicate that there are
strong multicollinearity or other numerical problems.Fit
The sixth model investigate the interaction effect of negative sentiment and Trump tweets on favorite count. Binary variables are added for Trump, Pence, and Harris, so again the reference category is Biden tweets. The R-squared is 0.17, indicating 17% of the variance of retweet count is explained by the model.
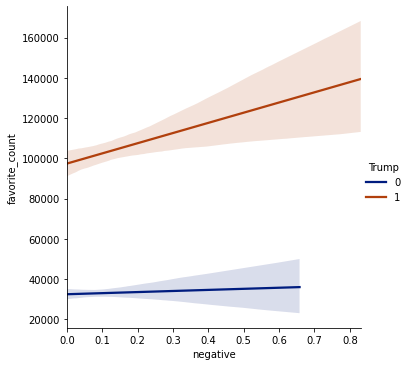
The greater positive effect of negative sentiment on favorite count for Trump can be visualized above.
Model 7: Interaction between negative sentiment and Republican tweets on retweet count
OLS Regression Results
==============================================================================
Dep. Variable: retweet_count R-squared: 0.129
Model: OLS Adj. R-squared: 0.129
Method: Least Squares F-statistic: 246.6
Date: Sun, 18 Oct 2020 Prob (F-statistic): 2.20e-246
Time: 18:28:37 Log-Likelihood: -91572.
No. Observations: 8317 AIC: 1.832e+05
Df Residuals: 8311 BIC: 1.832e+05
Df Model: 5
Covariance Type: nonrobust
=======================================================================================
coef std err t P>|t| [0.025 0.975]
---------------------------------------------------------------------------------------
Intercept 1.533e+04 488.693 31.365 0.000 1.44e+04 1.63e+04
negative 2267.6330 1974.335 1.149 0.251 -1602.557 6137.823
Republican 5560.0105 428.633 12.971 0.000 4719.783 6400.238
negative:Republican 3.444e+04 3487.129 9.878 0.000 2.76e+04 4.13e+04
length -35.9548 2.003 -17.955 0.000 -39.880 -32.029
media -4785.3198 348.785 -13.720 0.000 -5469.026 -4101.613
==============================================================================
Omnibus: 11548.701 Durbin-Watson: 1.330
Prob(Omnibus): 0.000 Jarque-Bera (JB): 6772282.307
Skew: 7.780 Prob(JB): 0.00
Kurtosis: 141.926 Cond. No. 4.68e+03
==============================================================================
Notes:
[1] Standard Errors assume that the covariance matrix of the errors is correctly specified.
[2] The condition number is large, 4.68e+03. This might indicate that there are
strong multicollinearity or other numerical problems.Fit
The seventh model investigate the interaction effect of negative sentiment and Republican tweets on retweet count. The R-squared is 0.13, indicating 13% of the variance of retweet count is explained by the model.
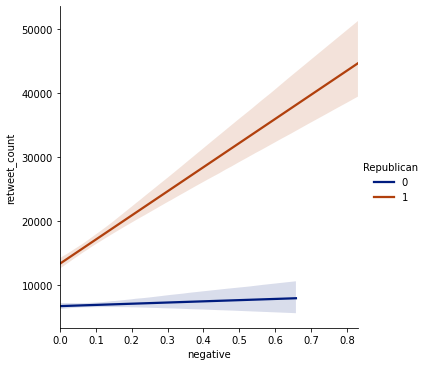
The greater positive effect of negative sentiment on retweet count for Republicans can be visualized above.
Model 8: Interaction between negative sentiment and Republican tweets on favorite count
OLS Regression Results
==============================================================================
Dep. Variable: favorite_count R-squared: 0.104
Model: OLS Adj. R-squared: 0.103
Method: Least Squares F-statistic: 192.6
Date: Sun, 18 Oct 2020 Prob (F-statistic): 9.64e-195
Time: 18:28:38 Log-Likelihood: -1.0569e+05
No. Observations: 8317 AIC: 2.114e+05
Df Residuals: 8311 BIC: 2.114e+05
Df Model: 5
Covariance Type: nonrobust
=======================================================================================
coef std err t P>|t| [0.025 0.975]
---------------------------------------------------------------------------------------
Intercept 9.257e+04 2667.140 34.707 0.000 8.73e+04 9.78e+04
negative -1.427e+04 1.08e+04 -1.324 0.185 -3.54e+04 6853.173
Republican 1.534e+04 2339.349 6.555 0.000 1.07e+04 1.99e+04
negative:Republican 1.403e+05 1.9e+04 7.374 0.000 1.03e+05 1.78e+05
length -226.8463 10.929 -20.756 0.000 -248.270 -205.422
media -3.134e+04 1903.565 -16.462 0.000 -3.51e+04 -2.76e+04
==============================================================================
Omnibus: 11283.257 Durbin-Watson: 1.329
Prob(Omnibus): 0.000 Jarque-Bera (JB): 4524473.945
Skew: 7.587 Prob(JB): 0.00
Kurtosis: 116.251 Cond. No. 4.68e+03
==============================================================================
Notes:
[1] Standard Errors assume that the covariance matrix of the errors is correctly specified.
[2] The condition number is large, 4.68e+03. This might indicate that there are
strong multicollinearity or other numerical problems.Fit
The eighth model investigate the interaction effect of negative sentiment and Republican tweets on favorite count. The R-squared is 0.10, indicating 10% of the variance of favorite count is explained by the model.
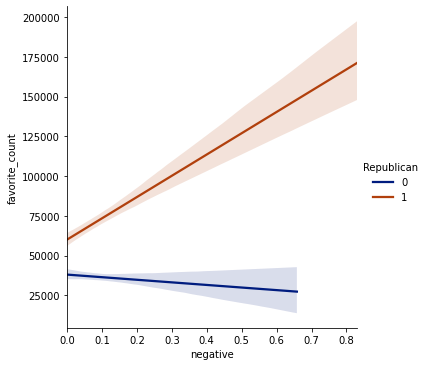
The greater positive effect of negative sentiment on favorite count for Republicans can be visualized above.
Machine Learning Models for predictive analytics
Two new varaibles are created for the interaction terms: one is negative by Trump and the other is negative by Republican.
| neg_trump | neg_rep | |
|---|---|---|
| 0 | 0.000 | 0.000 |
| 1 | 0.000 | 0.000 |
| 2 | 0.173 | 0.173 |
| 3 | 0.000 | 0.000 |
| 4 | 0.000 | 0.000 |
Predictive Model for Model 5
Because the interaction term was significant in all the models, and because the R-squared slightly increased in the models that included the interaction term, the predictive models were made that mirrored that interaction models.
LinearRegression()Above the code to create a Machine Learning model for Predictice Analytics for Model 5.
array([13471.48241824])A Biden tweet that is not negative, that is 50 characters long, and does not have media is projected to have 13,471 retweets.
array([17046.72594331])A Biden tweet that is completely negative, that is 50 characters long, and does not have media is projected to have 17,047 retweets. That is an increase of 3,576 tweets.
array([24598.25359172])A Trump tweet that is not negative, that is 50 characters long, and does not have media is projected to have 24,598 retweets.
array([44106.63682023])A Trump tweet that is completely negative, that is 50 characters long, and does not have media is projected to have 44,106 retweets. That is an increase of 19,508 tweets, a much larger increase than for Biden.
Predictive Model for Model 6
LinearRegression()array([85354.96269929])A Biden tweet that is not negative, that is 50 characters long, and does not have media is projected to have 85,354 favorites.
array([80469.89261586])A Biden tweet that is completely negative, that is 50 characters long, and does not have media is projected to have 80,469 favorites. That is a decrease of 4,885 favorites.
array([118453.34119362])A Trump tweet that is not negative, that is 50 characters long, and does not have media is projected to have 118,453 favorites.
array([173078.08302607])A Trump tweet that is completely negative, that is 50 characters long, and does not have media is projected to have 173,078 favorites. That is an increase of 54,625 favorites.
Predictive Model for Model 7
LinearRegression()array([13530.29502519])A Biden or Harris tweet that is not negative, that is 50 characters long, and does not have media is projected to have 13,530 retweets.
array([15797.92798289])A Biden or Harris tweet that is completely negative, that is 50 characters long, and does not have media is projected to have 15,797 retweets.
array([19090.30549902])A Trump or Pence tweet that is not negative, that is 50 characters long, and does not have media is projected to have 19,090 retweets.
array([55802.67925931])A Trump or Pence tweet that is completely negative, that is 50 characters long, and does not have media is projected to have 55,802 retweets.
Predictive Model for Model 8
LinearRegression()array([81227.274972])A Biden or Harris tweet that is not negative, that is 50 characters long, and does not have media is projected to have 81,227 favorites.
array([66958.12512068])A Biden or Harris tweet that is completely negative, that is 50 characters long, and does not have media is projected to have 66,958 favorites.
array([96562.36954165])A Trump or Pence tweet that is not negative, that is 50 characters long, and does not have media is projected to have 96,562 favorites.
array([222631.76330142])A Trump or Pence tweet that is completely negative, that is 50 characters long, and does not have media is projected to have 222,631 favorites.
Lime for Model 5
[1.73e-01 1.00e+00 1.73e-01 0.00e+00 0.00e+00 1.96e+02 0.00e+00]
Intercept -5121.505631164369
Prediction_local [26287.6598739]
Right: 24935.6080733102Here we can see how Model 5 came to its prediction for the second tweet in the data. A trump tweet, without media, with a length of 196 characters, and a negative polarity score of 0.17 has a predicted retweet count of 24,935.61.
Lime for Model 6
[ 0. 1. 0. 0. 0. 56. 0.]
Intercept -26271.41612258483
Prediction_local [116061.35526025]
Right: 117439.30043697983Here we can see how Model 6 came to its prediction for the third tweet in the data. A Trump tweet, without media, with a length of 56 characters, and a negative polarity score of 0 has a predicted favorite count of 117,439.30.
Lime for Model 7
[ 0. 1. 0. 76. 0.]
Intercept 8697.157851260308
Prediction_local [18527.49277237]
Right: 18155.479650879075Here we can see how Model 7 came to its prediction for the tenth tweet in the data. A Republican tweet, without media, with a length of 76 characters, and a negative polarity score of 0 has a predicted reweet count of 18,155.48.
Lime for Model 8
[2.14e-01 1.00e+00 2.14e-01 2.65e+02 0.00e+00]
Intercept 26688.734561201883
Prediction_local [64141.42040882]
Right: 74769.27471108577Here we can see how Model 8 came to its prediction for the thirtieth tweet in the data. A Republican tweet, without media, with a length of 265 characters, and a negative polarity score of 0.21 has a predicted favorite count of 74,769.27.
Evaluation
Model 2 (F(6, 8310) = 425.3, p < .001, R2 = .24) is the preferred model for investigating the main effect of negativity on retweet count. The coefficient for negativity in this model is positive and is statistically significant (β = 7,869.09 , p < .001). This provides support for H1a. The predictions made by the predictive models validate this.
Model 4 (F(6, 8310) = 284.7, p < .001, R2 = .17) is the preferred model for investigating the main effect of negativity on favorite count. The coefficient for negativity in this model is positive and is statistically significant (β = 11,150 , p < .001). This provides support for H1b. Taking into consideration the significance testing models and the predictive models, it becomes clear that negative sentiment in a tweet is associated with greater engagement with that tweet.
For the interaction between negativity and Trump tweets on retweet count, Model 5 (F(7, 8309) = 368.6, p < .001, R2 = .24) is utilized. The coefficient for the interaction between negativity and Trump tweets is positive and statistically significant (β = 15,930 , p < .001). This provides support for H2a and the predictive models back this up.
For the interaction between negativity and Trump tweets on favorite count, Model 6 (F(7, 8309) = 245.6, p < .001, R2 = .17) is utilized. The coefficient for the interaction between negativity and Trump tweets is positive and statistically significant (β = 59,510, p = .002). This provides support for H2b. Taking into consideration the significance testing models and the predictive models, it becomes clear that the positive effect of negative sentiment on tweet engagement is moderated by whether the tweet was from Trump or not. In other words, negative tweets by Trump was associated with greater engagement than negative tweets by Biden.
Similar findings were found for H3a and H3b. Both Model 7 (F(5, 8311) = 246.6, p < .001, R2 = .17) and Model 8 (F(5, 8311) = 192.6, p < .001, R2 = .10) have a positive coefficient for the interaction between negativity and Republicans tweets on retweet count (β = 34,440, p < .001) and on favorite count (β = 140,300 , p < .001). These results provide solid support for H3a and H3b.
It is clear that negative sentiment is positively associated with tweet engagement, both in terms of retweet count and favorite count. It makes sense to argue that Biden should be more negative in his tweets. However, this conclusion become muddied when trying to determine whether Biden should go negative. Though doing so will increase his overall engagement, the effect will be even greater for Trump. If they get in a war of words that is increasingly negative, Trump will benefit a significant deal more than Biden. This finding is also true when comparing Trump and Pence to Biden and Harris: negative tweet sentiment is associated with a greater increase the overall Twitter engagement for Republicans relative to Democrats. As such, this project’s recommendation to the organization is not to go completely negative. The occasional negative tweet from Biden can help increase engagement, but by going completely negative, Biden runs the risk of actually helping Trump more than himself. A continuation of the status-quo, where Biden is already somewhat negative, is therefore recommended.
Limitations and Next Steps
While this project attempted to be as comprehensive as possible, there are still several limitations both to the data and the analysis that must be considered. The data is limited in two majors ways. First, as previously discussed, this data was restricted to the four politicians that are currently running for executive office of the United States. Based on this, the results and implications drawn cannot be used to generalize about other elections or other politicians. It is possible that the results would be quite different if the tweets were collected for candidates of a Senate or House race or if a similar project was conducted in a different country. Therefore, because of this data limitation, the conclusions drawn should only be for the present US Presidential Election and should not be generalized to other Presidential elections or really any other election, Presidential or not. As the present project was about the present US Presidential Election, however, this limitation is understandable. Future similar research projects could increase the generalizability of the results by including politicians for a wide range of elections, both at the local level and the national level.
Second, and more importantly, the data is also limited by Twitter’s API, as it only allows you to obtain the last 3,200 tweets from a user. While all the gathered were posted during the election cycle, they do not represent the same time span. The last 3,200 tweets for Biden date back until October 2019, while the last 3,200 tweets from Trump only date back to July 2020. This is problematic as it could lead to a confounding variable of time. For example, an event in early 2020 that led to many tweets with negative sentiment would be represented in Biden’s data, but not Trump’s. To remedy this, future projects should obtain the tweets a different way in order to include all tweets posted during the election cycle. This could be accomplished by creating or using a Twitter scrapper that is capable of scrapping all users tweets. Then all tweets that were not posted during the election cycle can be dropped from the data or excluded from the scrapper.
From an analysis perspective, this project was also limited in two major ways. As previously mentioned, the OLS regression assumption of normality could be violated due several variables not being normally distributed. While this does not bias the statistical estimates, it could undermine the significance tests. This would could be addressed by checking the normality assumption with tests such as the Durbin-Watson test. If it is found normality assumption is violated, the log of the variables could be taken or a different model that does not have the normality assumption, such as the Generalized Linear Model, could be used. Additionally, future studies should also check the other regression assumptions in addition to normality.
The final limitation is related to the use of the negative polarity scores as the variable for sentiment. There is an alternative variable of the compound sentiment score, which includes positive, neutral, and negative sentiment. As this project was focused on just the negative sentiment, it used the negative polarity scores. Since VADER also gives the compound polarity scores, future projects could investigate if the results hold when all three aspects of sentiment are included.
Ethical and Normative Considerations
All studies should consider the potential ethical and normative issues posed by their work, but this problem becomes even more acute for digital data and machine learning projects, including this one. In many regards, this ethical concerns are mitigated by the design and purpose of this project. For example, this project maintains complete respect for human autonomy, one of the guidelines for ethical AI according to the High-Level Expert Group on Artificial Intelligence (AI HLEG) established by the European Commission, as all the decisions about the tweet are still made by humans. This project was to better inform the communications team of the best use of Twitter. It did not decide which tweets were posted or how they were written. The project also has high levels of transparency and explicability as all the data is public (all tweet posts are public and the VADER sentiment package is open source), and the predictions made by the machine learning analysis can be explained through the use of LIME.
With that said, the present project is not without its ethical considerations. The first, and possibly most important, issue is the possibility to do harm (European Commission, 2018). This project investigated whether being more negative in tweet sentiment led to more engagement for four of the most prominent politicians in the world. While the overall recommendation was not to increase the amount of negative tweets, the positive effect of negative sentiment and tweet engagement was documented by this project. As such, it is possible that an organization’s takeaway is negativity increases engagement, which would lead to increasing levels of negativity in political campaigns. Further, if a similar report were to be conducted by the Trump campaign, they would certainly recommended increasing negativity in tweets as it benefits Trump more than Biden. In either case, this project or one similar to it could lead to increasing negativity in politics, would could be quite harmful both at the individual level and the societal level. Therefore, the overall harm caused by the recommendations must be taken into account.
A second concern is that this project could lead to the manipulation of consumer, or in this case, citizens (Finn & Wadhwa, 2014). Projects making recommendations about the ideal tweet sentiment could lead politicians to make insincere comments or flat-out falsehoods. For example, politicians might post very negative tweets about a topic to rally their base, even if they do not care about such issues. Further, it may lead them to negatively spin different event and policies just for the sake of increasing engagement. This would be a manipulation of the people. Instead of stating their true intentions and beliefs, projects such as these could lead politicians to mislead or lie in order to be more popular. Therefore, any recommendations made by such projects should be clear that changes in sentiment should not be conflated with changes in issues or opinions.
Finally, from a normative perspective, this project could have an effect on the Presidential Election, which could be problematic. This raises the question of what degree is society comfortable with AI helping to make decisions that could have profound effects on Presidential Elections. Further, as just mentioned, projects like these could lead to an increase in negativity in society, at least for political social media. Increasing negativity is potentially harmful to society and something society must consider when projects such as these are employed.
References
Carraro, L., & Castelli, L. (2010). The Implicit and Explicit Effects of Negative Political Campaigns: Is the Source Really Blamed? Political Psychology, 31(4), 617-645. doi:10.1111/j.1467-9221.2010.00771.x
European Commission (2019). ETHICS GUIDELINES FOR TRUSTWORTHY AI. High-Level Expert Group on Artificial Intelligence. https://ec.europa.eu/futurium/en/ai-alliance-consultation
Finn, R. L., & Wadhwa, K. (2014). The ethics of “smart” advertising and regulatory initiatives in the consumer intelligence industry. Info, 16(3), 22-39. doi:10.1108/info-12-2013-0059
Gilbert, C. H. E., & Hutto, E. (2014, June). Vader: A parsimonious rule-based model for sentiment analysis of social media text. In Eighth International Conference on Weblogs and Social Media (ICWSM-14).
Han, X., Gu, X., & Peng, S. (2019). Analysis of Tweet Form’s effect on users’ engagement on Twitter. Cogent Business & Management, 6(1). doi:10.1080/23311975.2018.1564168
Jost, J. T. (2017). Ideological Asymmetries and the Essence of Political Psychology. Political Psychology, 38(2), 167-208. doi:10.1111/pops.12407
Jost, J. T., Glaser, J., Kruglanski, A. W., & Sulloway, F. J. (2003). Political conservatism as motivated social cognition. Psychological Bulletin, 129(3), 339-375. doi:10.1037/0033-2909.129.3.339
Lee, J., & Xu, W. (2018). The more attacks, the more retweets: Trump’s and Clinton’s agenda setting on Twitter. Public Relations Review, 44(2), 201-213. doi:10.1016/j.pubrev.2017.10.002
Ott, B. L. (2016). The age of Twitter: Donald J. Trump and the politics of debasement. Critical Studies in Media Communication, 34(1), 59-68. doi:10.1080/15295036.2016.1266686
Oz, M., Zheng, P., & Chen, G. M. (2017). Twitter versus Facebook: Comparing incivility, impoliteness, and deliberative attributes. New Media & Society, 20(9), 3400-3419. doi:10.1177/1461444817749516
Soroka, S., & Mcadams, S. (2015). News, Politics, and Negativity. Political Communication, 32(1), 1-22. doi:10.1080/10584609.2014.881942
Soroka, S., Fournier, P., & Nir, L. (2019). Cross-national evidence of a negativity bias in psychophysiological reactions to news. Proceedings of the National Academy of Sciences, 116(38), 18888-18892. doi:10.1073/pnas.1908369116
Trussler, M., & Soroka, S. (2014). Consumer Demand for Cynical and Negative News Frames. The International Journal of Press/Politics, 19(3), 360-379. doi:10.1177/1940161214524832